> ## Documentation Index
> Fetch the complete documentation index at: https://docs.adsumnetworks.com/llms.txt
> Use this file to discover all available pages before exploring further.
# 3-layer debug
> Debug a BLE bug across all three layers: the app log, the HCI host-controller bus, and the over-the-air radio, correlated to show exactly where a flow broke. A guided sample run walks a real bug end to end, with no hardware needed.
The hardest BLE bugs hide between the layers. The app log says everything looks fine, but a notification never arrives, a reconnect drops, or a flow stalls. The truth is one layer down, on the bus or on the air, where the application never sees it.
Adsum debugs across all three observability layers of a BLE connection and correlates them, so you see exactly where a flow actually broke:
* **App log** — the RTT/UART output your firmware prints. What the application thinks happened.
* **HCI (host-controller bus)** — the Host Controller Interface event stream, decoded to human-readable BLE events. What the host actually told the controller to do, and what came back.
* **Over-the-air radio** — the sniffer capture. What actually hit the air.
 ## Try it with no hardware
The fastest way to see it is the **guided sample run**, on a bundled sample with nothing of your own open:
From the home, pick the three-layer BLE debug sample. No board, no key, no project of your own needed.
The walkthrough follows a real one-directional BLE bug: the app log is blind to it, the HCI bus shows the gap, and the over-the-air capture confirms it, landing on the one-line fix.
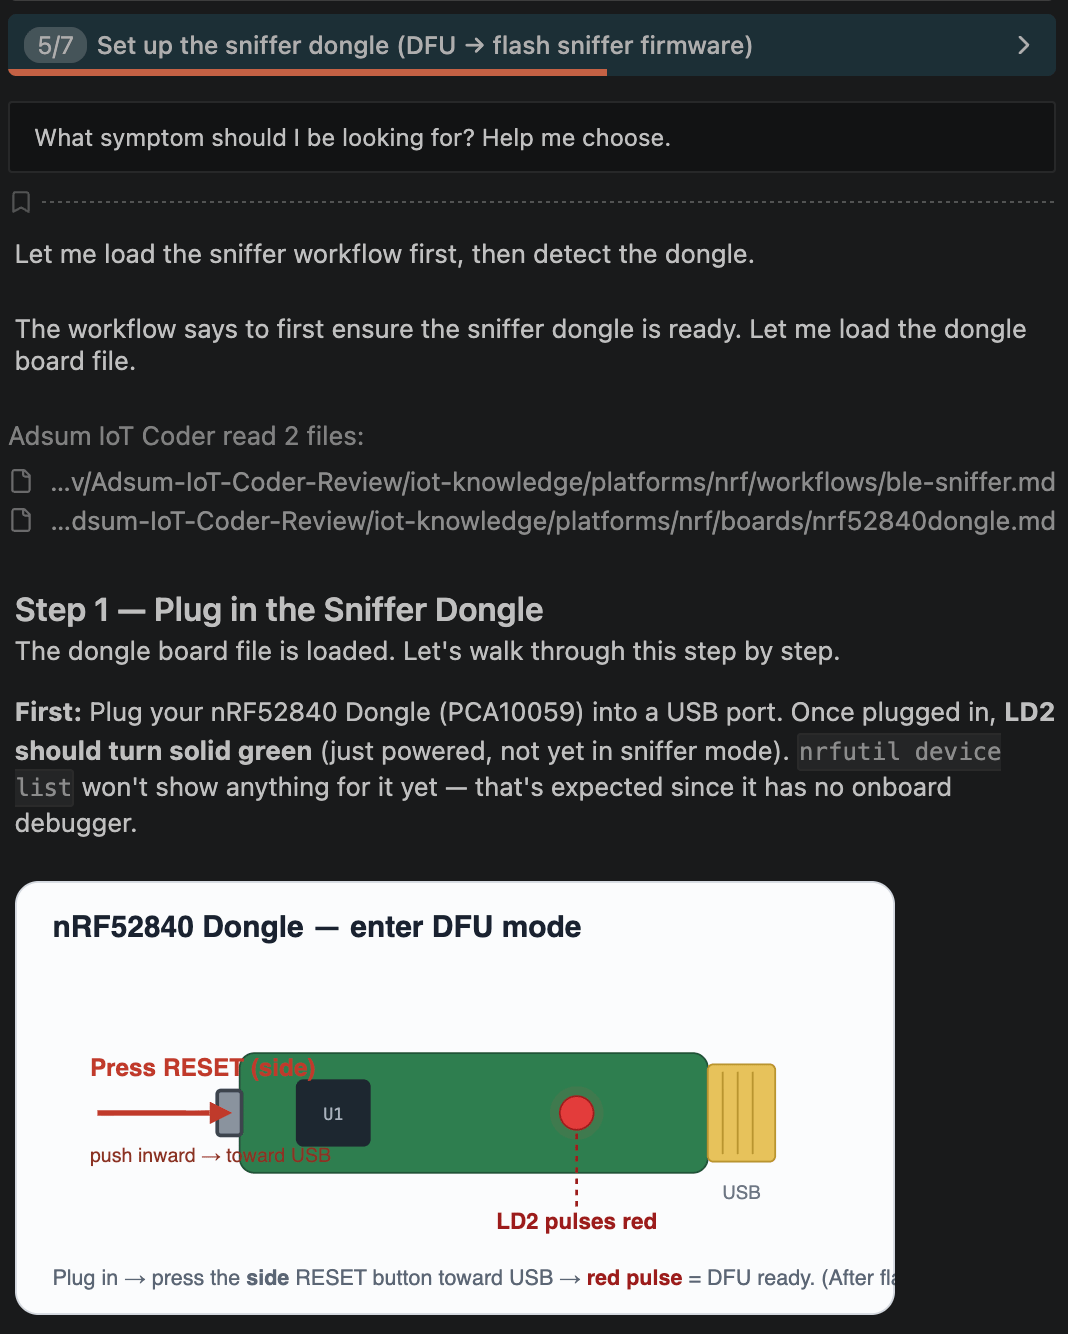
The same debugging runs on your own nRF boards. The guided run walks you through the sniffer-dongle setup, including the hardware steps, so you can capture the radio layer on your bench.
## How it works
The agent loads a curated nRF debug workflow and the relevant board knowledge, then walks the steps with you. It parses the HCI event stream into readable BLE protocol events, correlates the three layers against each other, and points at the exact place a flow broke, rather than dumping packets for you to read. The radio layer uses a standard nRF52840 dongle as the sniffer; the walkthrough handles the DFU-mode and firmware-flashing setup.
It bridges into the [CRA readiness check](/cra-readiness) too: once you understand a BLE flow, you can check the same build's secure-by-design posture in one click.
## Scope and honesty
* Available for **Nordic nRF** BLE projects today (`CONFIG_BT` detected). Extending 3-layer decoding beyond BLE is on the [roadmap](/platforms-and-roadmap).
* Adsum is an AI-based coding agent and can make mistakes. It narrates the decode and proposes the fix; you confirm it on your hardware.
## Try it with no hardware
The fastest way to see it is the **guided sample run**, on a bundled sample with nothing of your own open:
From the home, pick the three-layer BLE debug sample. No board, no key, no project of your own needed.
The walkthrough follows a real one-directional BLE bug: the app log is blind to it, the HCI bus shows the gap, and the over-the-air capture confirms it, landing on the one-line fix.
The same debugging runs on your own nRF boards. The guided run walks you through the sniffer-dongle setup, including the hardware steps, so you can capture the radio layer on your bench.
## How it works
The agent loads a curated nRF debug workflow and the relevant board knowledge, then walks the steps with you. It parses the HCI event stream into readable BLE protocol events, correlates the three layers against each other, and points at the exact place a flow broke, rather than dumping packets for you to read. The radio layer uses a standard nRF52840 dongle as the sniffer; the walkthrough handles the DFU-mode and firmware-flashing setup.
It bridges into the [CRA readiness check](/cra-readiness) too: once you understand a BLE flow, you can check the same build's secure-by-design posture in one click.
## Scope and honesty
* Available for **Nordic nRF** BLE projects today (`CONFIG_BT` detected). Extending 3-layer decoding beyond BLE is on the [roadmap](/platforms-and-roadmap).
* Adsum is an AI-based coding agent and can make mistakes. It narrates the decode and proposes the fix; you confirm it on your hardware.